

How can you improve your PPC advertising campaigns by stepping back, using PPC graph tools and visual reports as a way of seeing the overall picture? Consider the following situation…
 What kind of boss is best? A boss who sits in his or her office all day, crunching numbers and paying attention to no-one, or a boss who spends time walking around the shop floor, seeing what people are doing in action and reviewing the progress of his or her company from an all-round, bird’s eye view perspective?
At Webrageous, we would opt for boss number two.
Sitting in your office, staring at data for hours on end is important in one respect and there are times when all bosses need to sit down with the figures and do some serious in-depth analysis, but it is easy to really lose sight of the big picture when you always work in this work. You cannot see the wood for the trees, as they say, and the same happens to the managers of PPC advertising.
How to improve your PPC advertising campaigns?
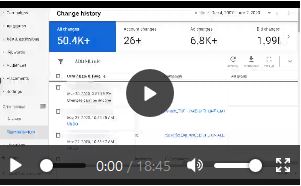
If you want to learn how to seriously improve your PPC advertising campaign, you need to learn how to use graph features and visual reporting systems made available to you by the likes of Google AdWords and spend time analyzing your PPC campaigns from a much broader perspective.
It can become futile to spend all day, every day, as a PPC manager / advertiser, looking at data, columns full of numbers and percentages, when you don´t ever step outside of your PPC management office, walk around your PPC campaign and see things from a broader perspective (like the effective boss would do in a busy office from time to time).
Perspective in PPC advertising is everything. It helps us to catch the things that we might have otherwise missed and graphs or visual report features help us to achieve the perspective that we need.
How can graphs and visual reports help to improve your PPC advertising campaigns and PPC management style in general?
Graphs and PPC visual reports help us to improve the management of our PPC advertising campaigns here at Webrageous in the following two ways:
1. They reveal to us where the real problems lie.
2. They show us new avenues that we can follow to achieve even better results in the future.
Instead of only looking at the PPC campaigns that we manage on a crude data level (click through rate, cost per click, page views, new visits, conversion rate, cost per conversion, etc.), when we analyze our campaigns using graphs and visual reports we see patterns we have emerged and we can track the sources of any changes more accurately.
For example, if you are only looking at figures and hard data, you might jump to a conclusion about a problem too soon. Maybe you assume that a trend of low bidding on your part was the cause of a low CTR, but when you bring up a Google Analytics visual report to check the same, you find that CTR is fine. So then you decide to look at another visual report which compares CTR in search campaigns to impressions in display campaigns, and so on.

Need Google Ads Management Help?
Free Google Ads account review for
qualified clients
Almost 20 years experience
The point is that visual reports can reveal surprises; they can prove your assumptions to be wrong and make these poor predictions clearer to the naked eye because they are in a visual form.
Who can help you begin to utilize the graph features and visual reports to take your PPC advertising to the next level?
If you understand nothing or very little about how to really make full use of the various graph, pictorial and visual reporting systems available to you as a PPC advertiser, contact the PPC management experts at Webrageous today.
We can act as a PPC consultant or PPC manager for you and show you how to use these visual reporting features to find the problems and opportunities that have remained a mystery to you from only committing yourself to hard data analysis.
Remember, PPC management is all about maintaining perspective and the only way to do that is to step out of the office (get away from the facts and figures of hard data) and wander around the office to get a more rounded perspective of your campaign overall.